
 SEGGER introduces the new DataPlot window for advanced data visualization in SystemView. The DataPlot window enables users to record and visualize custom data samples over time.
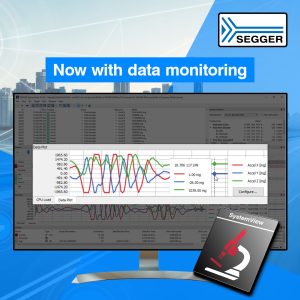
When analysing system behaviour, inspecting variable data is a handy tool for verifying how the embedded system is functioning. SystemView’s new data recording feature enables developers to record such variable data alongside runtime information events. The new DataPlot window presents a visualization of the recorded data in scope-like graphs, which are synchronized with SystemView’s Timeline and CPU Load windows. This provides information about the variable value and behaviour in each context of the system, ultimately helping to verify system behaviour or find root causes of unwanted behaviour.
“The ability to send and show data in SystemView had been on my SEGGER wishlist”, said Erich Styger, lecturer, professor & researcher. “I have found it very helpful for use with multiple sensor values. Uses include monitoring the use of dynamic memory over time, the power profile of executing code, and the inputs and outputs of control algorithms. Thank you SEGGER!”
“SystemView is a unique tool for understanding exactly what is happening in an embedded system, tracing interrupts, task switches, API calls and other user events with cycle accuracy, typically better than 5 ns,” said Johannes Lask, product manager of SystemView at SEGGER. “SystemView is free for evaluation and non-commercial use under SEGGER’s Friendly License. No additional hardware is required. Just download and give it a try!”
As an example, a system which monitors its power consumption can record the measured samples with SystemView. With the visualization in the DataPlot window and the instant synchronization with runtime information, developers can easily identify spikes in current and increases in power usage, synchronized to the task or event that triggered it.
